AI Automated Insights
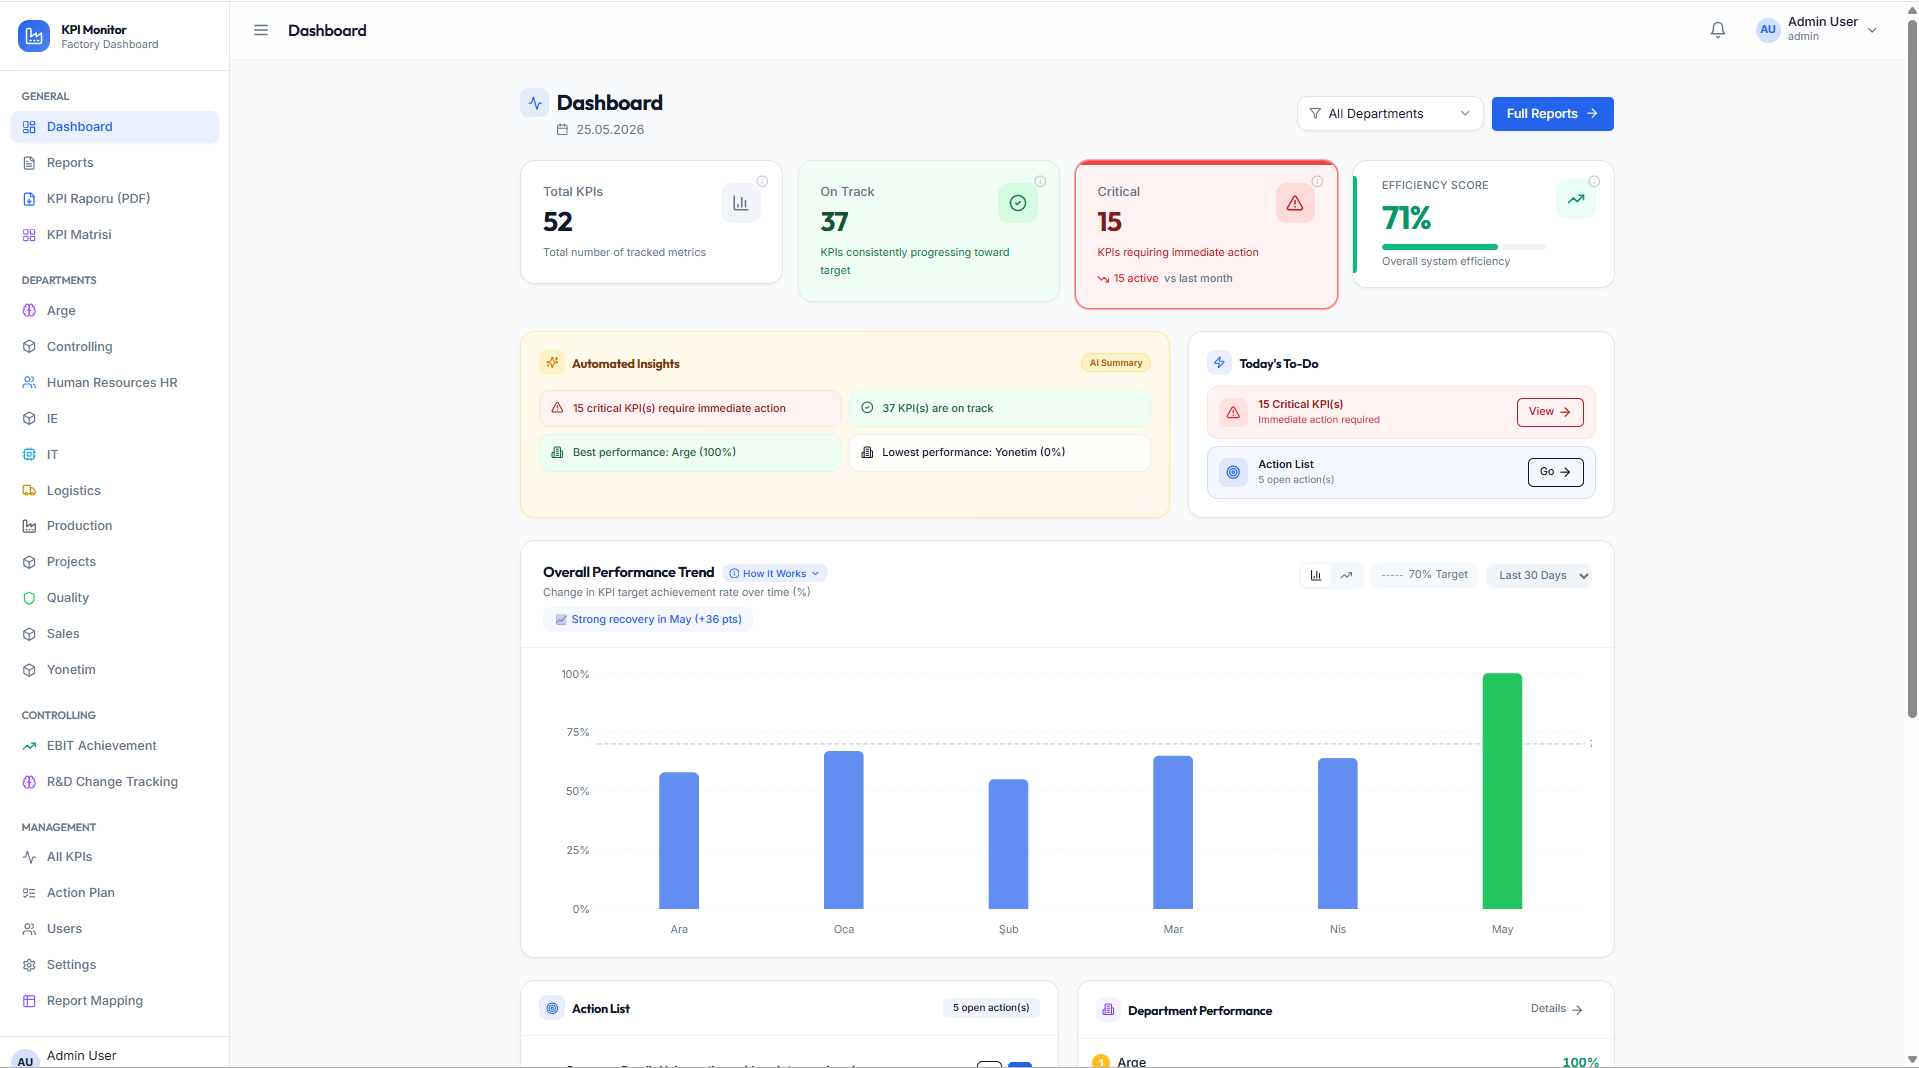
The AI engine continuously scans all KPIs and surfaces an Automated Insights panel on the dashboard, flagging critical items that require immediate action, highlighting best-performing departments, and identifying the lowest performers — without any manual analysis.
Real-Time Dashboard
The main dashboard aggregates Total KPIs, On Track count, Critical count, and an overall Efficiency Score in summary cards. A Today's To-Do widget links critical KPIs to an Action List, while the Overall Performance Trend chart shows month-by-month achievement rates with target reference lines.
KPI Performance Matrix
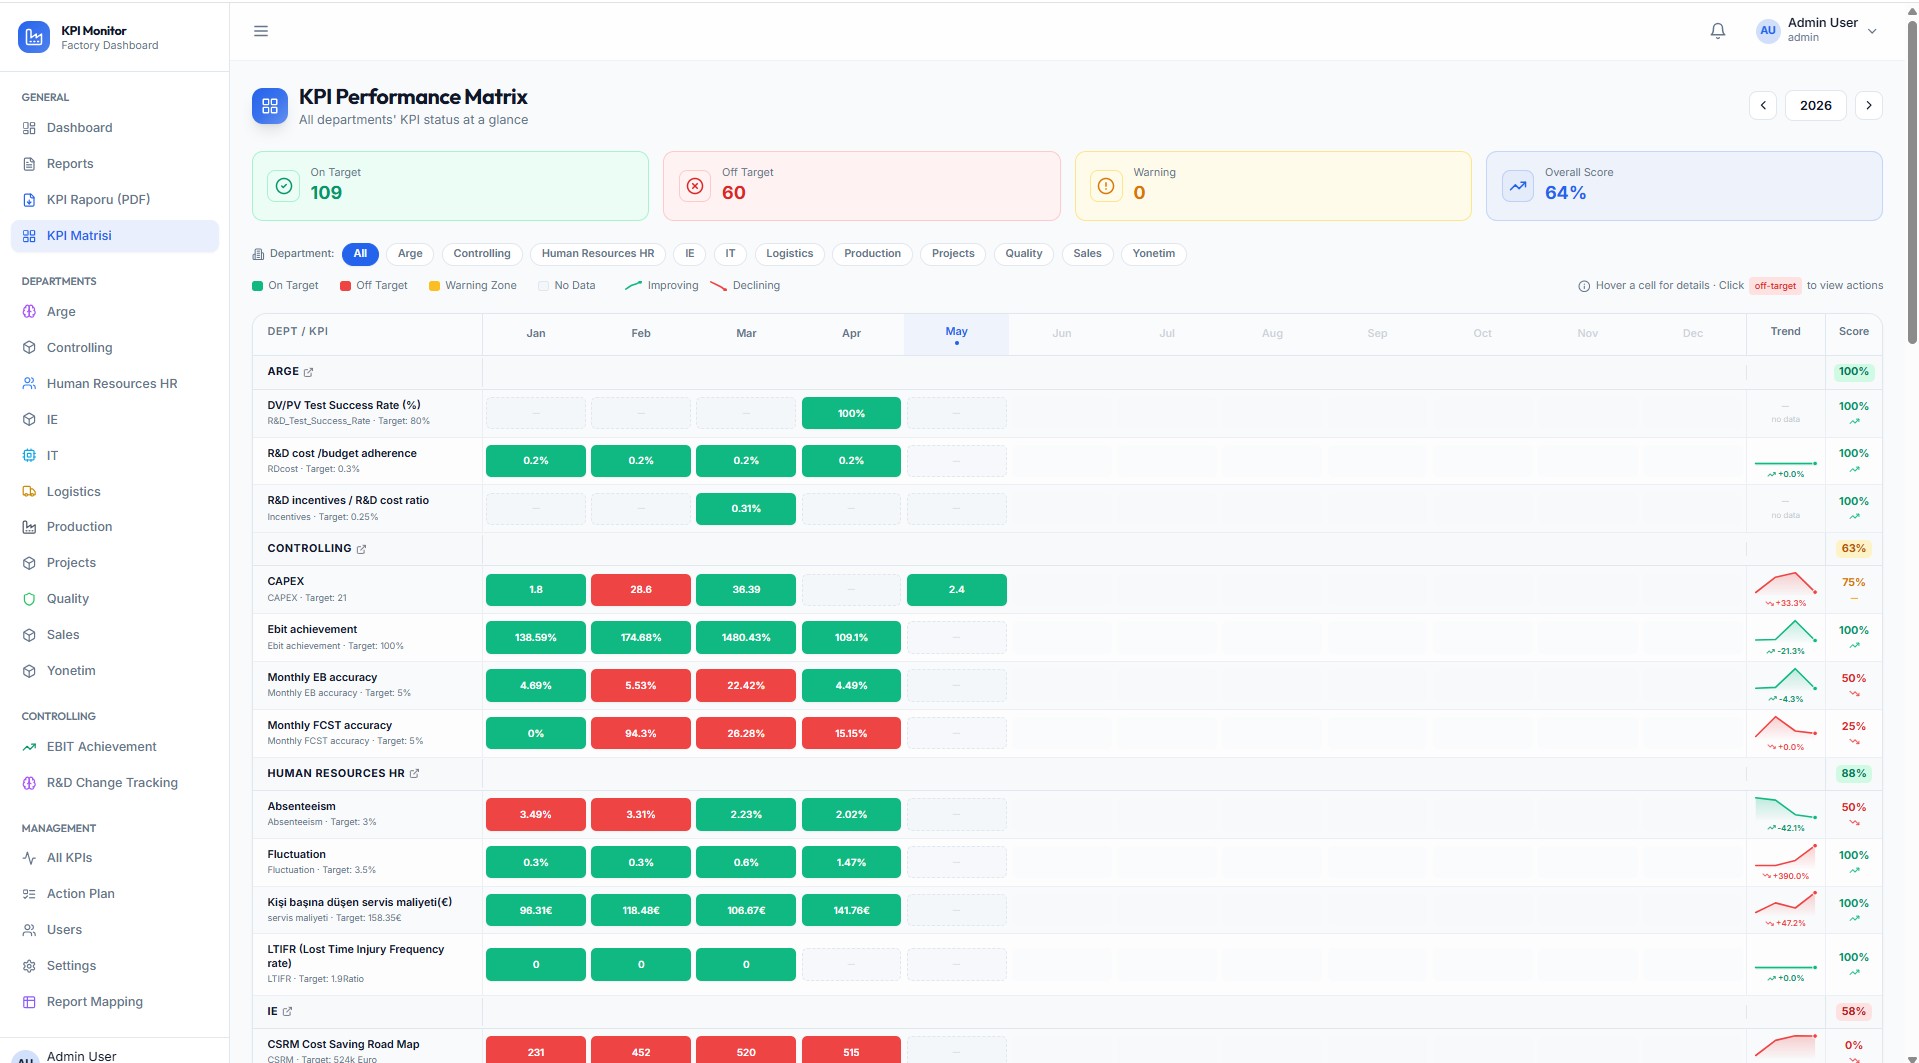
A full year-by-department matrix gives management a bird's eye view of every KPI status. Cells are colour-coded (On Target / Off Target / Warning Zone / No Data / Improving / Declining) and include trend arrows and score summaries per department. Clicking a cell drills directly into the KPI detail.
Performance Reports
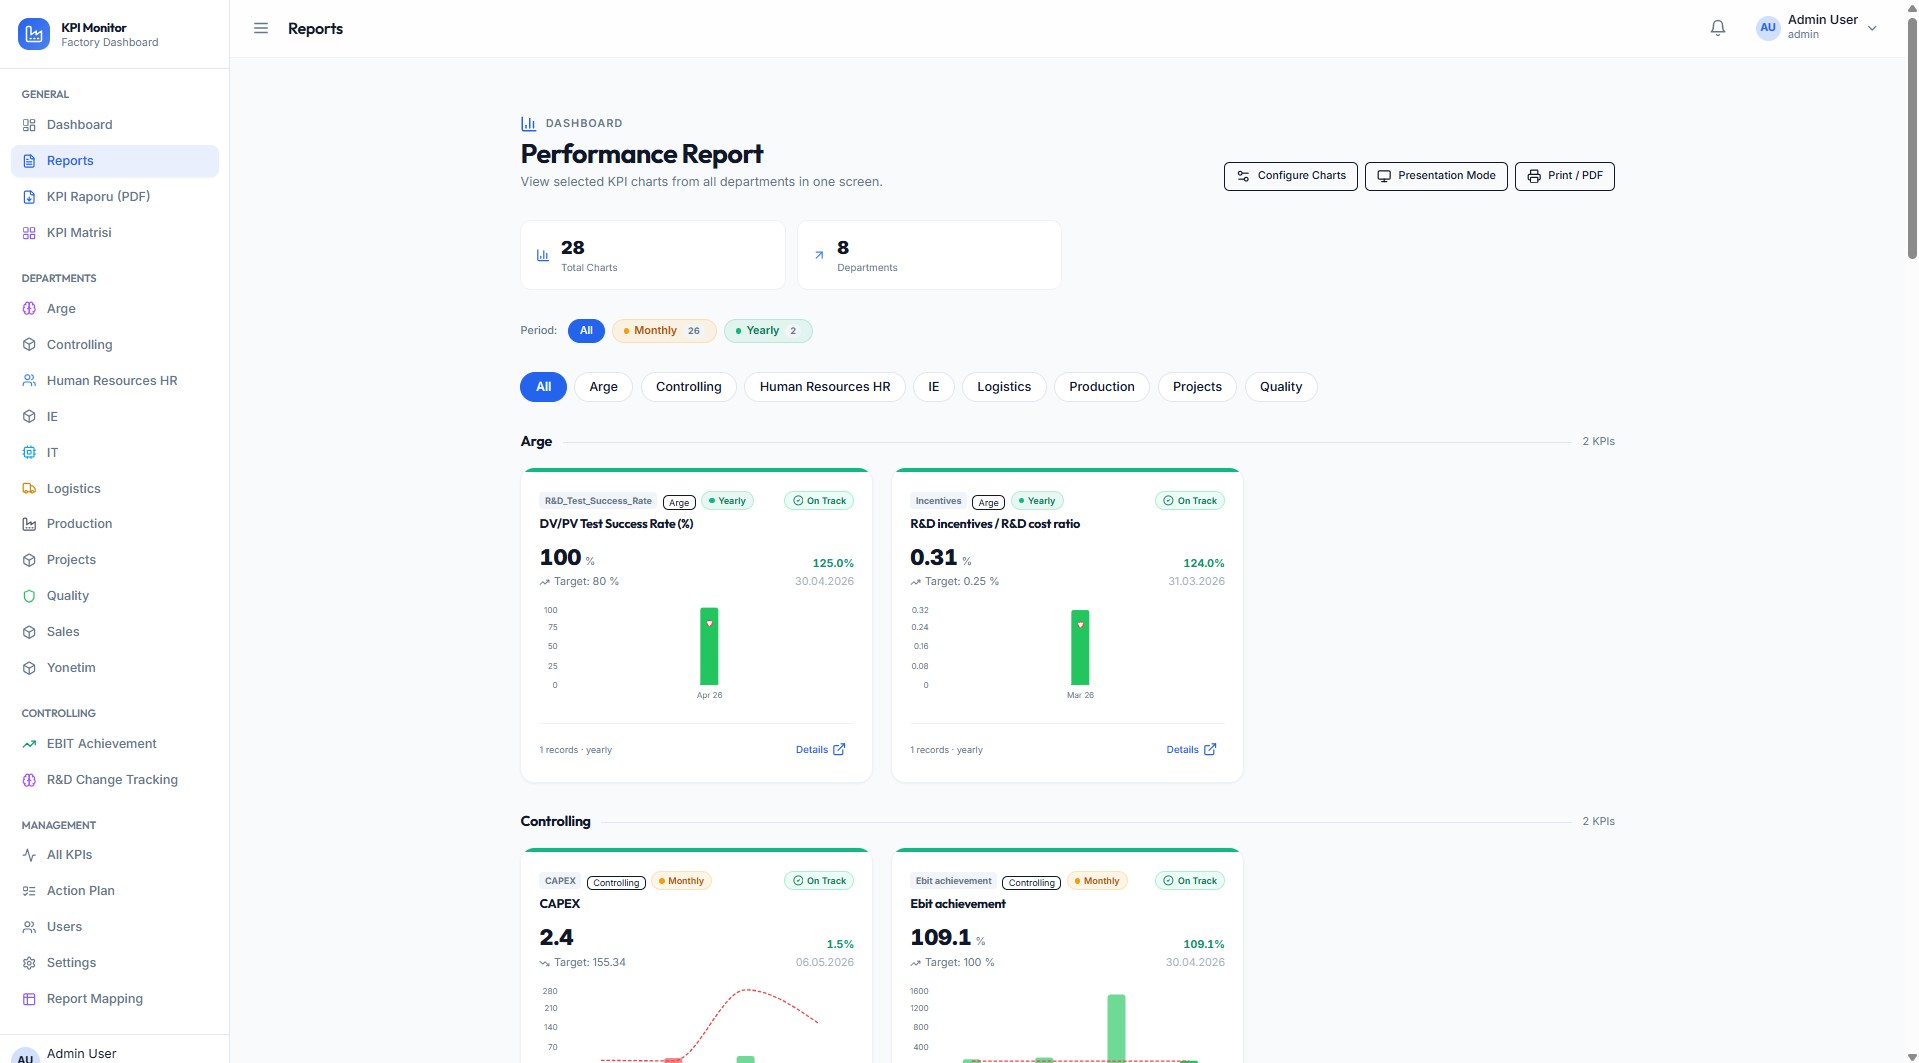
The Reports view aggregates KPI charts from all departments on a single screen. Filter by period (All, Monthly, Yearly) and switch between department tabs. Each KPI card displays the latest value, target, achievement rate, and a mini trend chart. The whole view can be toggled into Presentation Mode for meetings and printed or downloaded as PDF.
KPI Report Builder
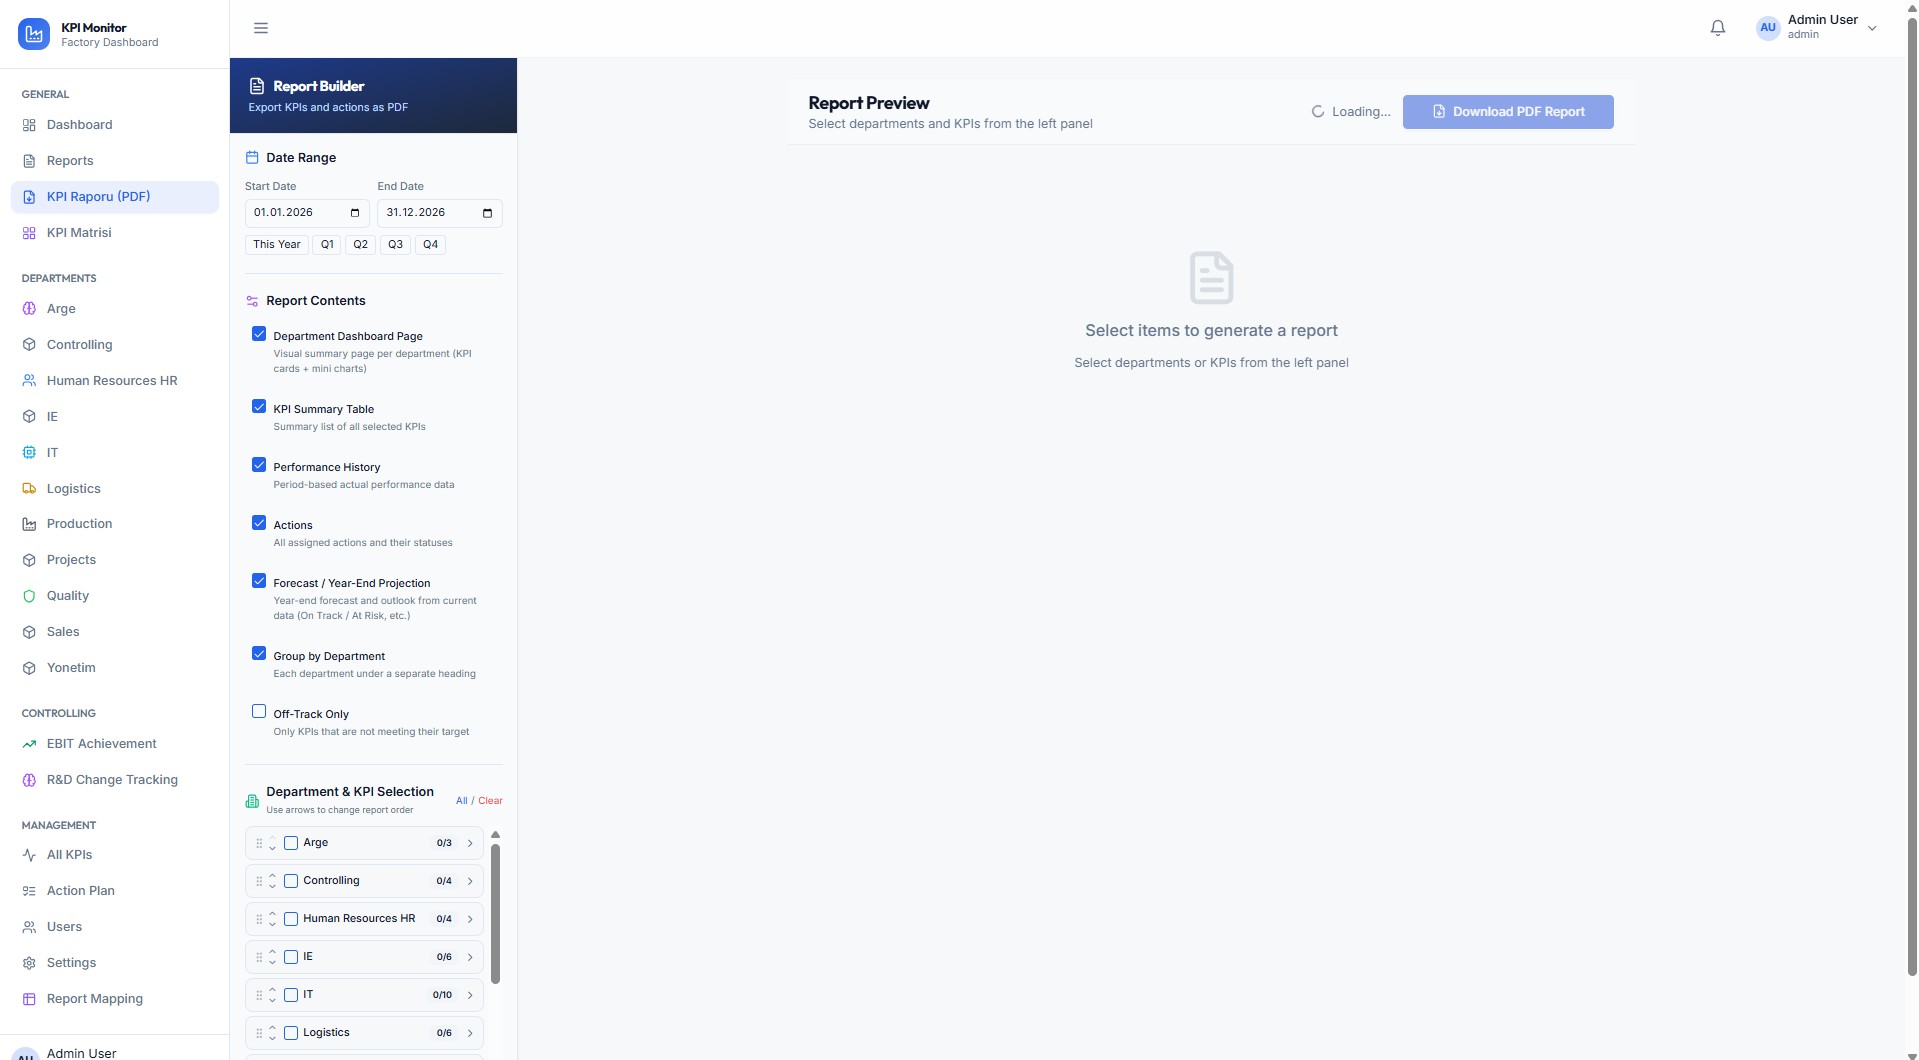
Build fully customised PDF reports by selecting a date range, choosing which sections to include (Dashboard Pages, KPI Summary Table, Performance History, Actions, Forecast/Year-End Projection, Group-by-Department, Off-Track Only), and picking the exact departments and KPIs. The live preview updates as you configure, then exports in one click.
Department & KPI Drill-Down
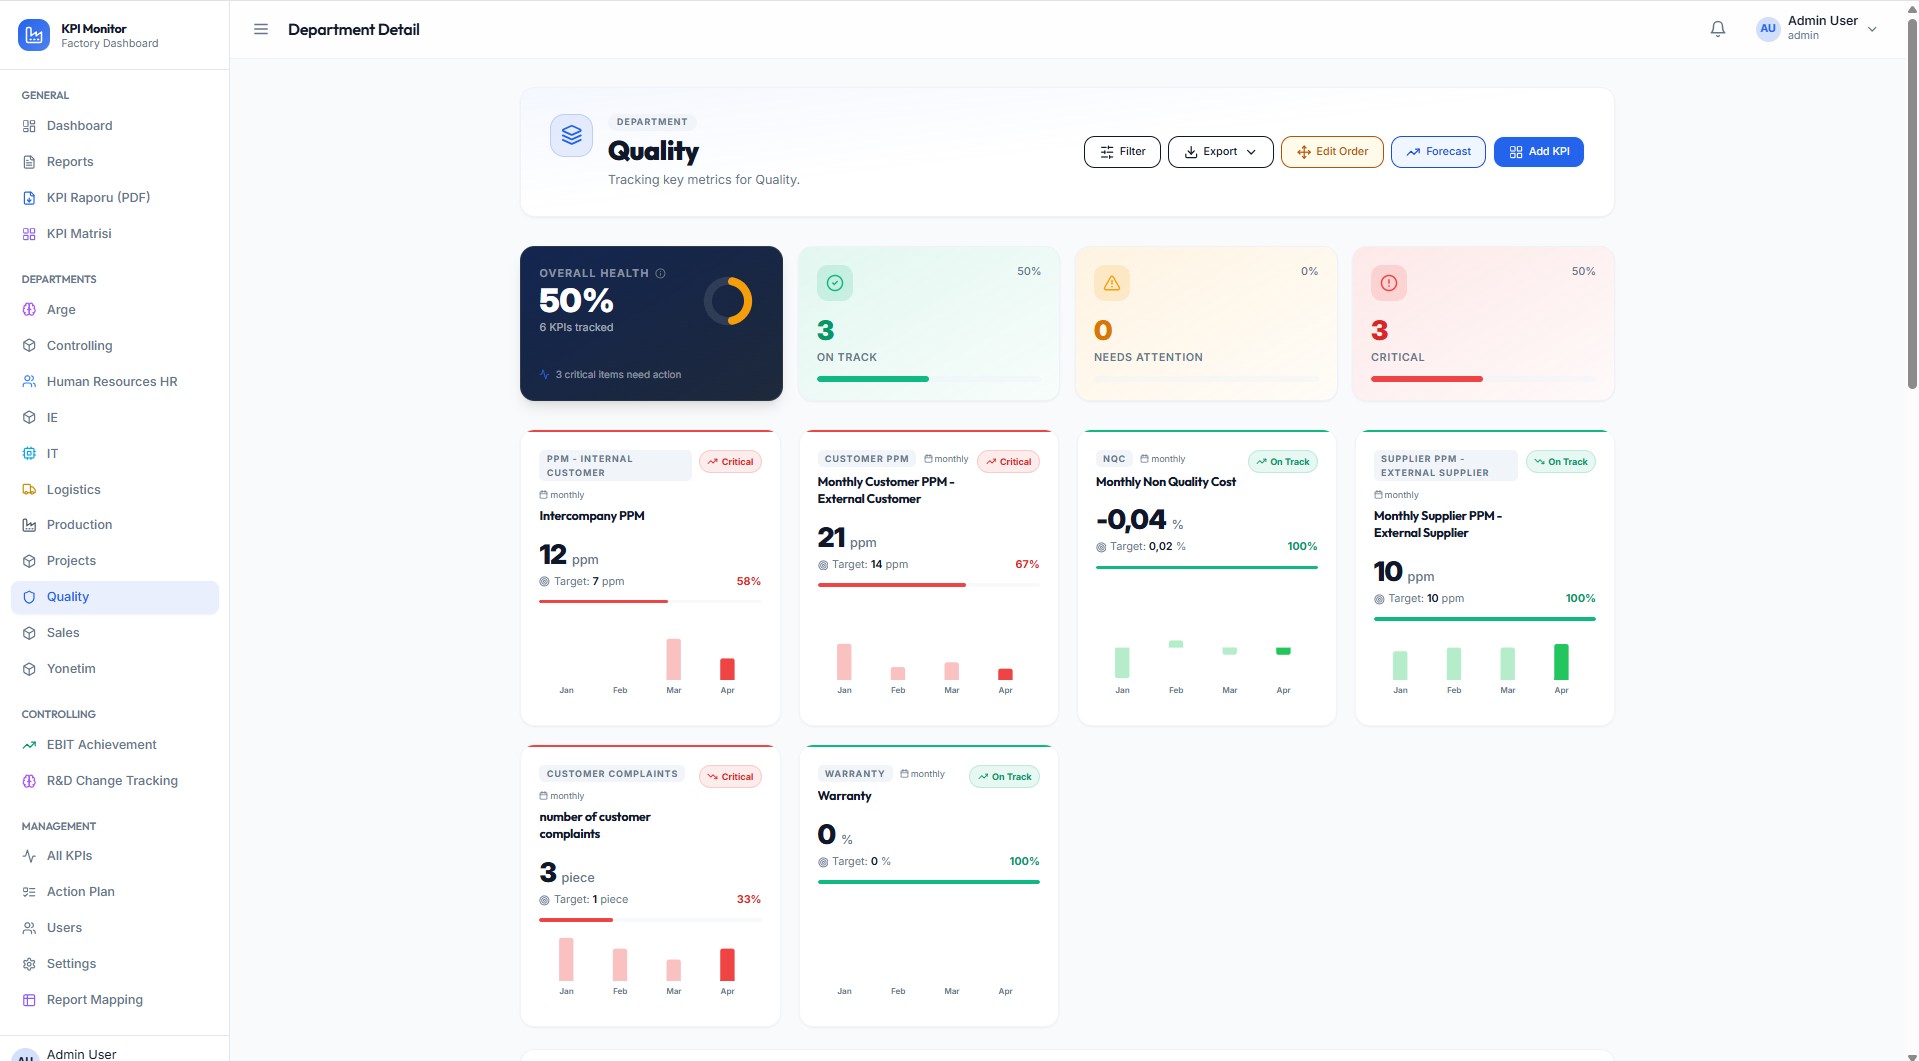
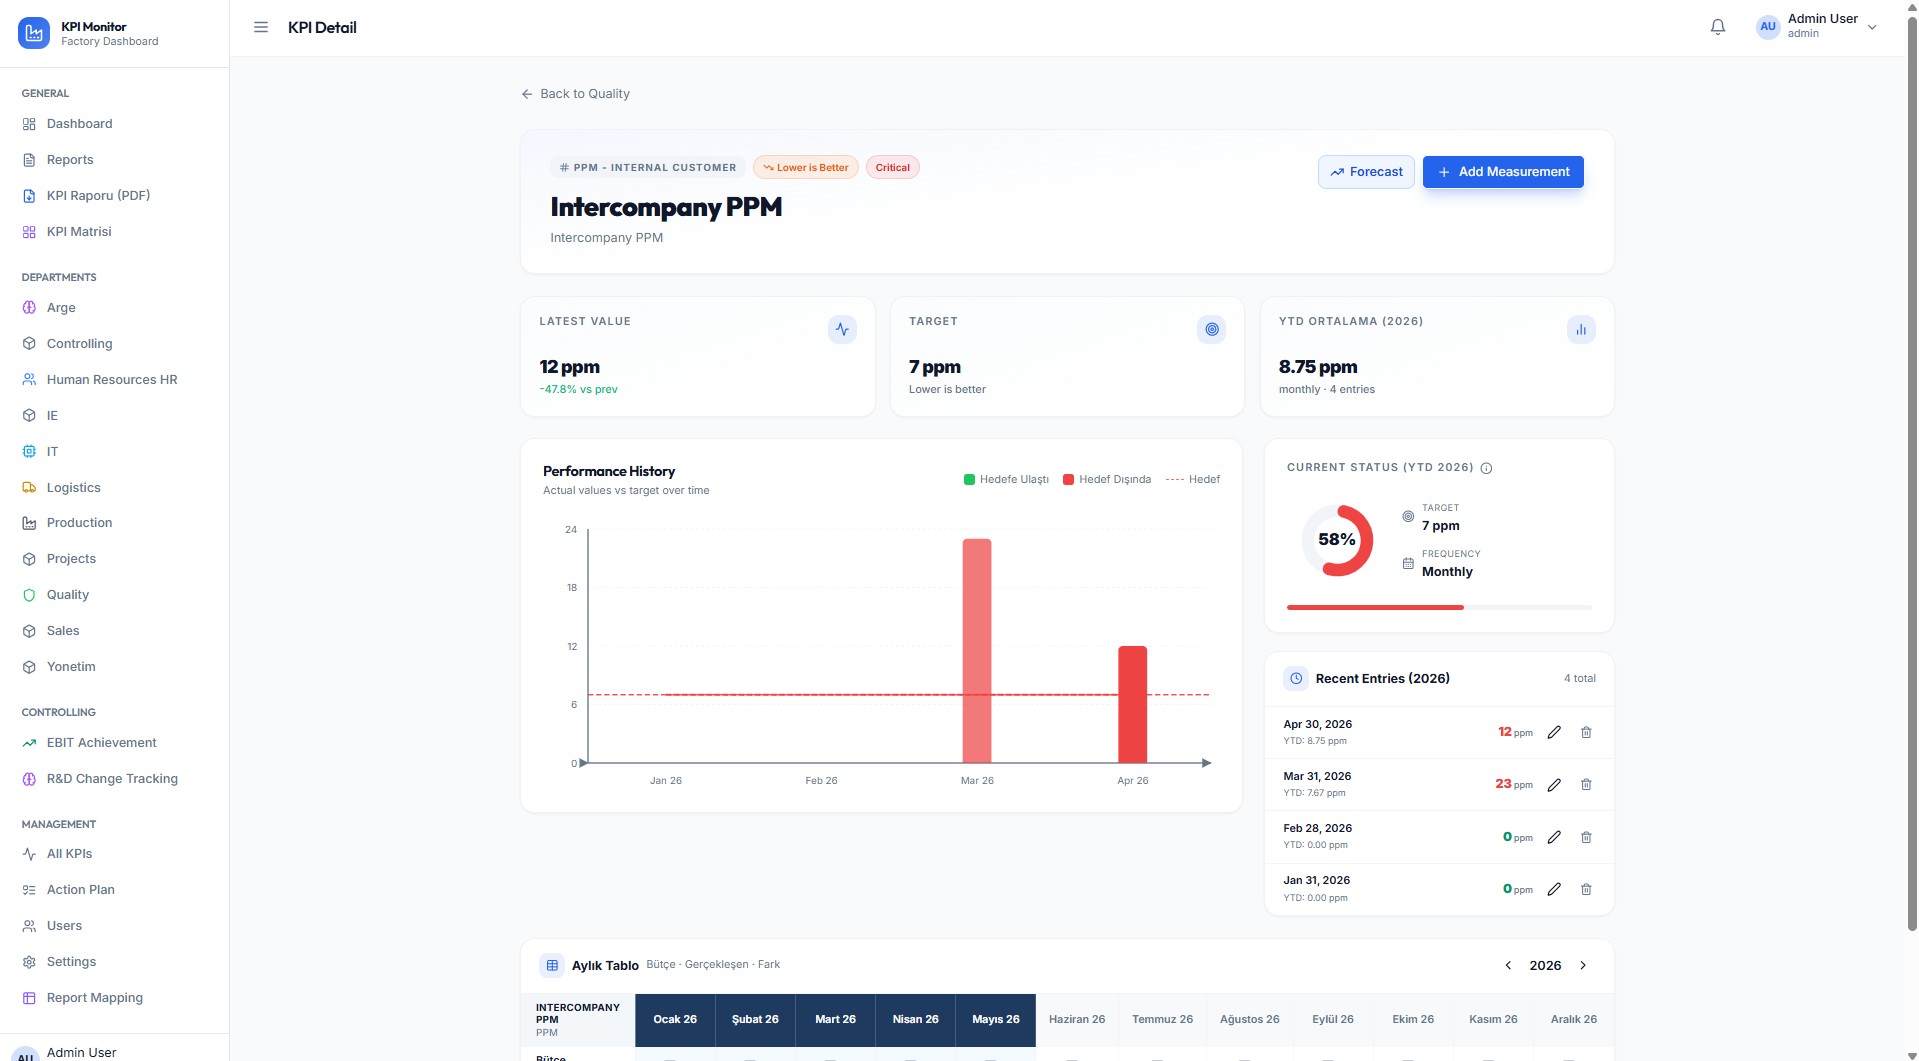
The Department Detail page shows an Overall Health score, on-track/needs-attention/critical counts, and individual KPI cards with mini charts. Clicking a KPI opens its full Detail page showing the latest value, target, YTD average, performance history chart, monthly data table, forecast, and measurement entry — all in one place.